Checking how long it will be until the next bus or train arrives may seem like a simple task. However, for this information to reach residents clearly and in an up-to-date manner, data from different operators needs to be integrated, transformed and presented in a single environment.
This is the aim of Use Case 6 of the Terrassa Smart Buildings project: to integrate and display public transport information so that it can be consulted on information screens located at different points throughout the city, as well as via the municipal website.
A single view for different modes of transport
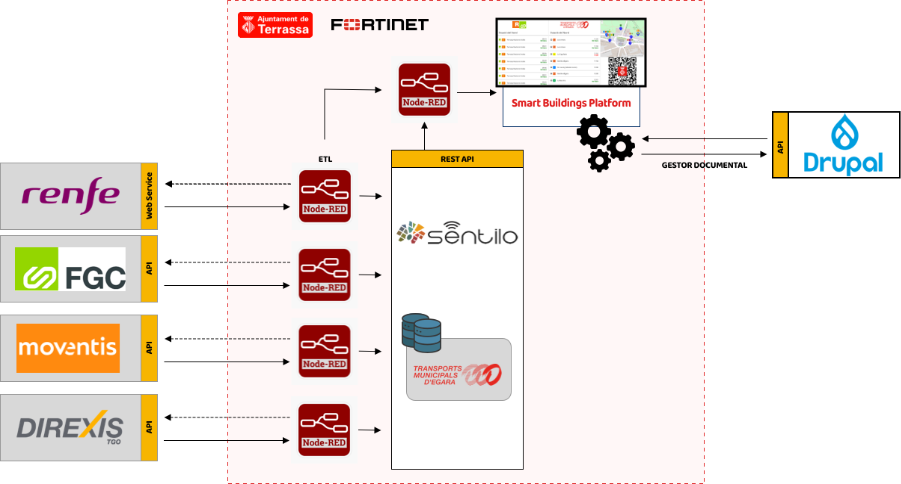
Mobility data does not come from a single source. The system integrates information from TMESA municipal buses, Renfe Rodalies trains, Ferrocarrils de la Generalitat de Catalunya (FGC), and interurban buses operated by Moventis and Direxis/TGO.
Each operator provides information through different services, such as REST APIs, web services or data files. The system collects daily timetable data and, whenever the provider offers real-time information, keeps the service status up to date.
The aim is to ensure that residents do not have to consult each operator separately, but can instead find the information they need to plan their journey in a single place.
How is data transformed into useful information?
The system follows an integration process consisting of several stages:
- Data collection: information is collected from the different transport operators.
- Integration and transformation: Node-RED adapts the relevant data into a common format.
- Centralisation: the information is transformed according to the NGSI-LD standard and stored in the FIWARE platform’s Context Broker.
- Visualisation: WireCloud enables the data to be presented in a customised way on information screens installed at different locations throughout the city.
This process makes it possible to transform data from different systems into coherent, understandable information that is ready to be consulted.
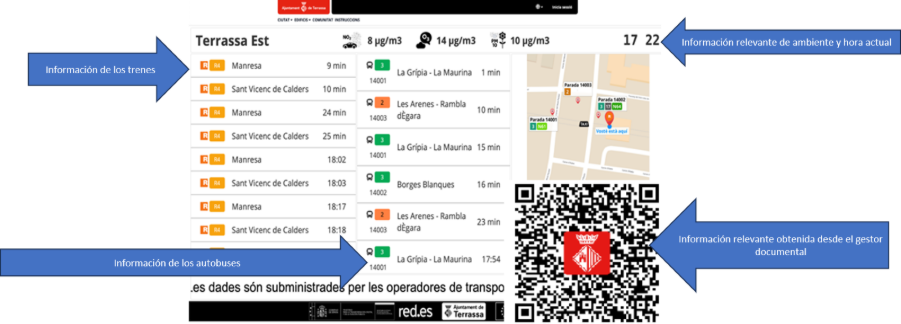
What information is shown to the public?
The public-facing display organises the information into three main areas:
- train information;
- bus information;
- municipal content of interest, such as weather and pollution data, images, videos, maps, alerts and QR links.
For trains, the display can show the operator, line, destination and time remaining until departure. For buses, it includes the line, stop, destination and estimated arrival time. The display prioritises the nearest transport services according to the location of each screen.
The information is complemented by a map that helps users identify nearby stops and can also show available taxi ranks.
Information screens across the city
The project includes information screens at nine locations: Hospital de Terrassa, the bus station, five FGC stations and two Renfe stations.
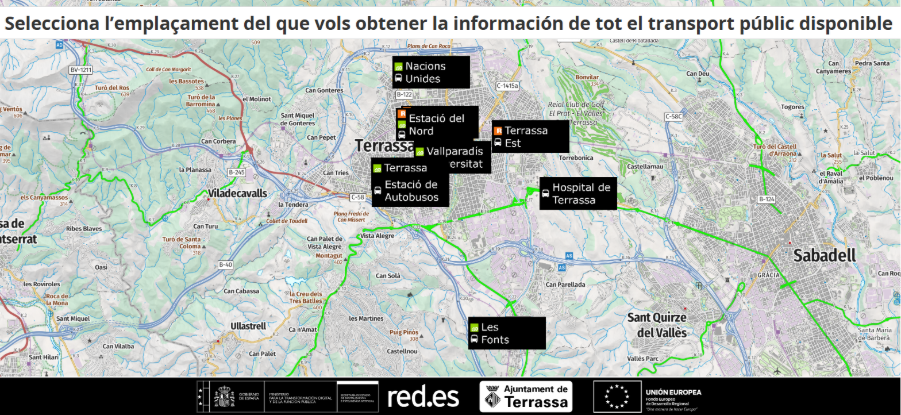
The content of each screen is adapted to its location. This means that the information displayed prioritises the nearest and most immediate transport services for people at that particular location.
The same display is also planned for the City Portal, with a version optimised for viewing on mobile devices.
How is the service monitored?
In addition to the public-facing display, the project includes a technical dashboard created using Apache Superset. This environment makes it possible to monitor the overall status of connections with providers and detect when a data source becomes unavailable.
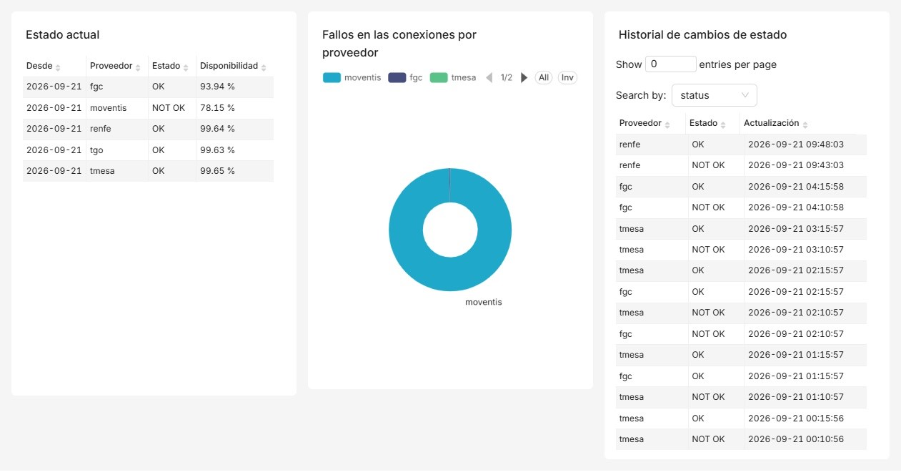
Monitoring is based on two main indicators:
Service availability by provider: measures the percentage of time during which each operator’s data is available.
Connection failure rate by provider: identifies the proportion of connection attempts that have not been completed successfully.
This monitoring helps municipal technical teams distinguish between information based on up-to-date data and information derived solely from scheduled services.
More information for better decision-making
Integrating mobility data makes it easier for residents to access public transport information in a single place. At the same time, it provides municipal teams with tools to monitor the availability of data sources and detect connection issues.
This initiative helps to:
- make journey planning easier;
- improve access to mobility information;
- make public transport options easier to understand;
- strengthen transparency;
- provide objective information to support better urban mobility management.
With this use case, Terrassa continues to move towards becoming a more connected city, where data is transformed into practical information that serves the needs of its people.

0 Comments